Jeremy Grantham on financial bubbles

James Montier, one of my favourite strategists and market commentators, formerly from SG, is now working for GMO.  Now that is very convenient for me, since I can now access two of my favourite commentators and strategist from one website! That is just a side comment though, since what I wanted to write about today, is the latest commentary from Jeremy Grantham in his quarterly letter for 1st Q 2010.  The link is here.

He has some excellent comments and discussion about the Graham and Dodd crowd and their investment strategy, which makes the read worthwhile on its own. But what has struck me, was their research into financial bubbles. His big point is the fact that ALL bubbles revert back to trend, as was the case for the previous 32! He makes special mention of the still existing UK and Australian housing bubbles and how they still defy their inevitable 40% decline back to trend because of artificial stimilus by their Governments.

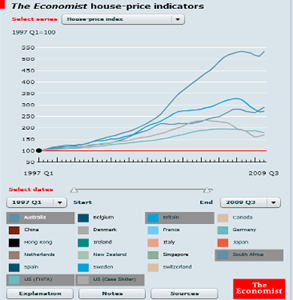
This of course had me wondering where we in SA stood as regards to our housing market, and today I read an article where they discuss the housing bubble in the UK and Australia compared to the US. This led to an interactive chart from “The Economist” where you can chart the relative house price increases over time.

The interactive chart at the Economist can be viewed here. As you can see, if the UK and Australia house market are regarded as being in “bubble” territory, then I don’t know how they will define SA’s right at the top!

Facts, arithmetic and thinking

“Thinking is very upsetting, it tells us things we’d rather not know.”

Dear fellow investors

It has been said that successful investing is something of an art and something of a science. I believe the science part is rather easy. It is the “art” part that separates the good from the ordinary. Of course the “art” part can include the successful use of the science part as well, so it can be rather contradictory.

Today I want to share with you a very interesting and informing speech and lecture that you might have seen before, but if not, try to make the time to watch the video or read the transcript. If nothing else, it will make you challenge the “growth curves” of the next investment presentation a bit more suspiciously.

Arithmetic, Population and Energy – a talk by Dr Al Bartlett, Professor Emeritus, Physics

Transcript: http://www.globalpublicmedia.com/transcripts/645

Video: http://www.albartlett.org/presentations/arithmetic_population_energy_video1.html

http://www.albartlett.org/presentations/arithmetic_population_energy.html

Buffet sells Moody’s

Dear fellow investors

A while ago I have noted that David Einhorn is short on Moody’s (MCO) and have forwarded his thesis to you. Previously Warren Buffet has also publicly noted that the intrinsic value of Moody’s has been impaired somewhat, but did not say by how much. This news article today shows that the impairment is enough that it pursuaded Buffet to start selling his Moody’s shares.

http://247wallst.com/2009/07/22/buffett-dumps-moodys-mco-brk-a/

Depression experience and perspective

Dear fellow investors

Below follows an interesting perspective from some of the oldest practicing value investors that invested during the 1930 depression.

http://www.smartmoney.com/Investing/Stocks/Stock-Pros-Who-Survived-the-Depression/?page=all

Stock Pros Who Survived the Depression

IRVING KAHN SITS AT HIS CLUTTERED DESK, PEERING AT his computer screen through thick, dark glasses. The Dow inched up 38 points today, a small move in light of its 332-point drop earlier in the week. But Kahn has made a career of betting on beaten-down stocks, and he’s hard at work poring over annual reports and studying balance sheets looking for companies that have lots of cash, not much debt and good long-term growth prospects. General Electric has a solid business and looks pretty good at these prices, he muses. General Motors? Not so much.

Like a lot of us, Kahn has seen good times and bad, bull markets and bear markets, recessions and recoveries. But he’s also seen something most of us haven’t: the Great Depression. Kahn, who still shows up at work every day and puts in a good six hours, worked as a stock analyst and brokerage clerk on Wall Street in the 1930s. He’s 103 years old.

Iron Ore and Coal Price Trends

I’ve updated the  graph in my previous post of the historic iron ore and coal prices for data up to end October 2008.  I have been right on the money since these prices have come down crashing the past few months.  I also have added the last year’s data of iron ore spot prices as indication of where contract prices might be headed next year.  The current spot coal price is around $95 and the spot iron ore price in China is around $85.

A copy of the new graph can be viewed here, iron-ore-coal-price-trends-updated

Reverting to the mean

In a previous post I explained my belief about relativity in expectations.  That is what makes markets and is the causes of different opinions.  I explained how many make the common mistake ( and completely natural human tendency)  of comparing to the most recent data available or last experiences  they were exposed to (the contrast principle).  This is in my view reflected in the current S&P earnings expectations and hence the market consensus of judging whether the current market is expensive or not on a historic P/E ratio.

As of today’s date, according to S&P, the trailing 12 month P/E for reported earnings till end June 2008 is 24.77 .  Looking forward the consesus estimate for the next 12 month’s earnings is a P/E of 18.97  .  Now if you compare this trailing 12 month P/E ratio to recent years, it does not look too expensive, the average P/E ratio for the past 10 years has been 27.  Looking back longer though, since 1871, the average P/E ratio has been 15, and that includes this last 10 years of abnormally high P/E ratios.

For years, John Y. Campbell and Robert J. Shiller have been calculating long-term P/E ratios.   According to their data, the 10 year average of earnings for the S&P is 55.5 .   Putting a “normal” long term average P/E ratio on top of that, and you get a S&P index value of around 830, compared to yesterday’s close of 1005.  Now, consider that we are in the worst financial and credit crises since the Great Depression and the highest levels of household credit in the history of mankind, and that normally during such stock market “corrections” the P/E ratio declines to levels far below average levels, what realistic expectations can one expect ?

On the earnings side, my view has been that analysts are still way too optimistic in their earnings forecasts for the next 12 months, forecasting a earnings level of 54 for the S&P 500, that is only down 20% on last years earnings.  Now consider that Toyota this morning came out and slashed their earnings forecast for next year, 55% below consensus estimates!

For the year to end-March, Toyota now expects operating profit of 600 billion yen ($6.1 billion) versus a previous forecast of 1.6 trillion yen. A poll of 17 brokerages had forecast 1.34 trillion yen.

Looking at the performance of long term P/E ratio’s, the work of Shiller and Campbell, beautifully illustrated in this article of the NY Times, and the graph here, sugggests that during a crises of this magnitude, P/E ratio’s can come down, and have consistently done so, to levels of below 10, and extremes of 5 in early 1920’s, about 6 during 1930’s and around 7 during the 1980’s.  Now lets take an average of the lowest 3, and a P/E of 10, and we get a realistic possibilty of a P/E ratio of 8 at the bottom of the current stock market correction.  That would imply a S&P 500 index level of 440 compared to a “normalized” current 10 year average S&P earnings of $55.  That is more than 50% below the current level!

These facts make it very difficult for me to become bullish on stocks in general for the foreseable future.  I will continue to be biased on  the short side, but be prepared to trade short term oppertunities on the long side.  Strict stop levels have to be adhered to however and the size of trades have to take into consideration that we still are in a very volatile bear market, and may be so for a long time still.

Everything is Relative

I believe it is Einstein that said “Everything is relative”.  It is my belief as well.  We hear so many “experts” on TV and in the financial press that stocks or certain assets are cheap.  Well, the question should always be, compared to WHAT ?  One person might compare prices to 3 or 6 months ago, another will compare to historic,  multi year , trends and price values and come to a completely different opinion.

Bennet Sedacca, president of Atlantic Advisors, has compiled beautiful graphics here in his excellent market commentaries, of the tales of different bubbles.  It shows clearly the folly of the pundits of long term investing, so often heard by market commentators.  The important lesson here, if you invest at the wrong time, ie high valuation level, then the “long term” might be 20 years or more for your investment to show a positive return, as is the case currently with the Jappanese stock market and numerous other examples in stocks etc.  The long term might even be eternity in some cases, and I don’t think people these days have long term time horizons for their investments anyway.

Further, you must be able to short as well, as it gives you an extra tool to use in difficult market conditions as now,  and even might exist for a couple of years to come.  Shorting however is more of an art and very difficult to master pschycologically, and that is probably why less than 1 % of the population will ever be able to do it.

World crude steel growth

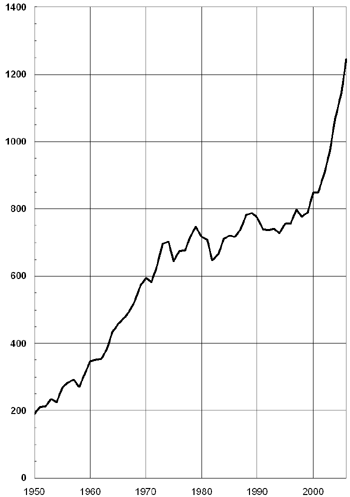
Here is a another graph (figures as of end 2006) that looks unsustainable in the medium term to me.  This figures from the International Iron and Steel Institute.

World crude steel production, 1950 to 2006

Allan Gray, an asset manager here in SA for which I have the highest respect, up there with Warren Buffet definitely, seems to agree in an interview on Moneyweb with my opinion that the Steel companies have had their day in the sun, and by implication I think the iron ore companies as well.  Neutral in my position on them at the moment, but waiting for an oppertune time to short them again.

The rise of US Debt levels

After some further reading and research I came across this article from the New York times via a Google Search and blog article from Steady Blogging.

It is a great visual interactive graphic of the rise and history of US consumer debt levels.  I suppose this is a reflection of what happened across the world as well, especially in countries with high debt levels.  From the NYT link, click on “series index”, then click on “The American Way of Debt” and then click “Launch Interactive”.

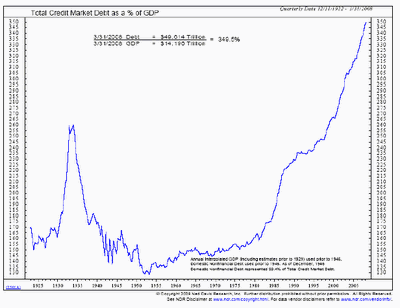
It is debt and credit growth that spurred the massive asset price inflation of the past 2 decades, and it is the restriction of credit growth or deleveraging of these debt levels that will limit asset growth or even deflate asset prices world wide.  Investors and traders need to have more than one tool in their tool box to be able to take advantage of this and protect their own capital.

A new era of Credit Growth?

I am constantly engaged in conversation with my broker (he seems to be the only one who agrees with me) about the current generation of people that have no memory of the Great Depression and who seems to believe the more credit the better.  The habit of “buy now, save later”.  I don’t think it can last, not here in SA, not in the US or in the rest of the world.  The savings of the Asian countries will not forever finance the spending of Western nations.

Credit growth is still high here in SA as well as in the US it seems.  The  document (click here) and the discussion here,  by Ives smith of Naked Capitalism all confirm my beliefs that the world as we know it currently is not sustainable in terms of credit growth and a return to the normal is inevitable.  This is not good news for stocks generally.

veneroso-why-the-second-wave-is-inevitable-61908

US Credit vs GDP Growth