Aligning management with owner interests

A lot has been said recently about excessive management pay and the pitfalls of option schemes.  I think,  and believe it is all about getting the incentives right for management, but more importantly, for outside minority shareholders as well.  The following article provide some good concepts for thought, and of course the remarks from Warren Buffet and Charlie Munger is as invaluable as always.

“Generally speaking, in life you get what you reward for.  If you want ants to come, you put sugar out.” (Charlie Munger)

CEOs Need to Bring Investors Along for the Ride ,
http://online.wsj.com/article/SB124121294473578541.html

And also Warren Buffet on the subject …

Berkshire Weekend: Buffett, Munger on Setting CEO Pay
Liz Claman of Fox Business Channel quotes or paraphrases the Berkshire chairman and vice chairman:
Question: If a board of directors makes a mistake with compensation – then the board issues incentive bias toward earnings manipulation. Bearing in mind rule number 1 – don’t lose money and if it’s okay to have losses in short-term if loss is widens. How do you develop a fair compensation for a subsidiary that requires a lot of capital?
Buffett: We’ve thought a lot about this. In a capital intensive business you have to have a factor in a compensation arrangement that includes a capital -cost element. We have dozens and dozens of subsidiaries and we have different arrangements for different businesses because businesses that don’t require capital like See’s and Business Wire are different than businesses that requires lots of capital.
I think your question implies that the board sets these thing. But in my experience – basically the board is having relatively little effect on it. The CEO has managed to be an important determinant of his or her own compensation arrangement. I’ve been on one comp committee of 19 boards… CEOs appoint the comp committee – they don’t look for Dobermans, they look for Cocker Spaniels. In my experience boards have done very little in the way of really thinking through as a owner about “what is the proper way to pay these people and incentivize them not to do the wrong thing?”
Not every CEO wants a rational compensation system. It’s a real problem. I don’t think there should be a compensation committee. I think it’s very important how you compensate the CEO. I said in our annual report – choosing the right CEO, making sure they don’t overreach…
Munger: I would argue that a liberally paid board of directors is counterproductive. You keep raising me and I keep raising you. It gets very club-like. I think corporations of America would better married if directors weren’t paid at all.

Iron Ore and Coal Price Trends

I’ve updated the  graph in my previous post of the historic iron ore and coal prices for data up to end October 2008.  I have been right on the money since these prices have come down crashing the past few months.  I also have added the last year’s data of iron ore spot prices as indication of where contract prices might be headed next year.  The current spot coal price is around $95 and the spot iron ore price in China is around $85.

A copy of the new graph can be viewed here, iron-ore-coal-price-trends-updated

Reverting to the mean

In a previous post I explained my belief about relativity in expectations.  That is what makes markets and is the causes of different opinions.  I explained how many make the common mistake ( and completely natural human tendency)  of comparing to the most recent data available or last experiences  they were exposed to (the contrast principle).  This is in my view reflected in the current S&P earnings expectations and hence the market consensus of judging whether the current market is expensive or not on a historic P/E ratio.

As of today’s date, according to S&P, the trailing 12 month P/E for reported earnings till end June 2008 is 24.77 .  Looking forward the consesus estimate for the next 12 month’s earnings is a P/E of 18.97  .  Now if you compare this trailing 12 month P/E ratio to recent years, it does not look too expensive, the average P/E ratio for the past 10 years has been 27.  Looking back longer though, since 1871, the average P/E ratio has been 15, and that includes this last 10 years of abnormally high P/E ratios.

For years, John Y. Campbell and Robert J. Shiller have been calculating long-term P/E ratios.   According to their data, the 10 year average of earnings for the S&P is 55.5 .   Putting a “normal” long term average P/E ratio on top of that, and you get a S&P index value of around 830, compared to yesterday’s close of 1005.  Now, consider that we are in the worst financial and credit crises since the Great Depression and the highest levels of household credit in the history of mankind, and that normally during such stock market “corrections” the P/E ratio declines to levels far below average levels, what realistic expectations can one expect ?

On the earnings side, my view has been that analysts are still way too optimistic in their earnings forecasts for the next 12 months, forecasting a earnings level of 54 for the S&P 500, that is only down 20% on last years earnings.  Now consider that Toyota this morning came out and slashed their earnings forecast for next year, 55% below consensus estimates!

For the year to end-March, Toyota now expects operating profit of 600 billion yen ($6.1 billion) versus a previous forecast of 1.6 trillion yen. A poll of 17 brokerages had forecast 1.34 trillion yen.

Looking at the performance of long term P/E ratio’s, the work of Shiller and Campbell, beautifully illustrated in this article of the NY Times, and the graph here, sugggests that during a crises of this magnitude, P/E ratio’s can come down, and have consistently done so, to levels of below 10, and extremes of 5 in early 1920’s, about 6 during 1930’s and around 7 during the 1980’s.  Now lets take an average of the lowest 3, and a P/E of 10, and we get a realistic possibilty of a P/E ratio of 8 at the bottom of the current stock market correction.  That would imply a S&P 500 index level of 440 compared to a “normalized” current 10 year average S&P earnings of $55.  That is more than 50% below the current level!

These facts make it very difficult for me to become bullish on stocks in general for the foreseable future.  I will continue to be biased on  the short side, but be prepared to trade short term oppertunities on the long side.  Strict stop levels have to be adhered to however and the size of trades have to take into consideration that we still are in a very volatile bear market, and may be so for a long time still.

Everything is Relative

I believe it is Einstein that said “Everything is relative”.  It is my belief as well.  We hear so many “experts” on TV and in the financial press that stocks or certain assets are cheap.  Well, the question should always be, compared to WHAT ?  One person might compare prices to 3 or 6 months ago, another will compare to historic,  multi year , trends and price values and come to a completely different opinion.

Bennet Sedacca, president of Atlantic Advisors, has compiled beautiful graphics here in his excellent market commentaries, of the tales of different bubbles.  It shows clearly the folly of the pundits of long term investing, so often heard by market commentators.  The important lesson here, if you invest at the wrong time, ie high valuation level, then the “long term” might be 20 years or more for your investment to show a positive return, as is the case currently with the Jappanese stock market and numerous other examples in stocks etc.  The long term might even be eternity in some cases, and I don’t think people these days have long term time horizons for their investments anyway.

Further, you must be able to short as well, as it gives you an extra tool to use in difficult market conditions as now,  and even might exist for a couple of years to come.  Shorting however is more of an art and very difficult to master pschycologically, and that is probably why less than 1 % of the population will ever be able to do it.

Historic Iron ore and Coal Prices

I try to identify trends to trade on multiple time frames.  It can be either to the long side or the short side.  For example I believe in the long term fundamentals of UEPS, a company I have been following for a couple of years.  I hold a core portfolio of their stock in a long term account here in SA.  Then I also have a trading account in the US with Ameritrade where I try to trade the swings in UEPS and other stocks.

I also hold an account with Interactive Brokers in the US where I trade my day trades in stocks and futures as well as forex.  Currently I focus on the short side of trades in the commodity sector, especially steel stocks and iron ore stocks, as I believe their fundamentals are fading.  I base my views on research of historic price trends combined with current news flow regarding the industry fundamentals.

See below graph for  historic prices for both Iron Ore and Coal.  If this does not look like a bubble for a commodity, then I don’t know how one looks like.  Also,  I have read research by a leading Asset manager here in SA that at current prices for both these commodities, the payback time for capital costs is 12 months, so that should encourage a lot of extra supply very quickly.

iron-ore-coal-price-trends

A Grandfather’s wish of lower US debt

I recently remarked that I don’t wish my children to inherit the debts of our generation, if we can avoid it.  It seems that I, as a father,  are not alone in that thoughts.  I came upon this website by Michael W. Hodges,  The Grandfather Economic Report.

Each generation hopes their children will have more freedom and economic opportunity.    Certain trends threaten their future.

with precious childrenIn some ways we may be SHORT-CHANGING OUR NEXT GENERATION, but blaming it on others will not make it better. Acquiring knowledge and taking action is an individual responsibility.

“By highlighting economic threats to our young, actions may result such that negative trends become positive trends – – and my generation can become more proud of our bequest to the next generation.”

I have only this to say about his work:  READ IT.  It should be prescribed material for back ground reading.  It shows his excellent dedication and opens one’s mind to what is going on in many parts of the world.  He focusses on the situation in the US, but it can probably serve as a posterchild to many western economies.

The future of Fiat currency

Thorsten Polleit  of the Ludwig von Mises Institute ,does a very good job of explaning,  with examples of simple balance sheets, what the current actions of the US Government in bailing out Wall Street are doing to its citizens.

The article is not specifically aimed at the US government, but rather in general, but you can put in your favourite government as example.

We currently find ourselves in a situation Ludwig von Mises warned against:

The boom produces impoverishment. But still more disastrous are its moral ravages. It makes people despondent and dispirited. The more optimistic they were under the illusory prosperity of the boom, the greater is their despair and their feeling of frustration. The individual is always ready to ascribe his good luck to his own efficiency and to take it as a well-deserved reward for his talent, application, and probity. But reverses of fortune he always charges to other people, and most of all to the absurdity of social and political institutions. He does not blame the authorities for having fostered the boom. He reviles them for the inevitable collapse. In the opinion of the public, more inflation and more credit expansion are the only remedy against the evils which inflation and credit expansion have brought about.[2]

He recons there is no escaping the eventual price that will have to be paid, the only question is how high that is going to be, and quotes von Mises ,

The alternative is only whether the crisis should come sooner as the result of a voluntary abandonment of further credit expansion, or later as a final and total catastrophe of the currency system involved.

I certainly don’t hope my children would have to bear that one day.

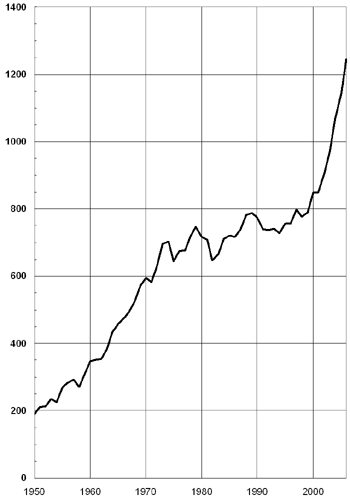
World crude steel growth

Here is a another graph (figures as of end 2006) that looks unsustainable in the medium term to me.  This figures from the International Iron and Steel Institute.

World crude steel production, 1950 to 2006

Allan Gray, an asset manager here in SA for which I have the highest respect, up there with Warren Buffet definitely, seems to agree in an interview on Moneyweb with my opinion that the Steel companies have had their day in the sun, and by implication I think the iron ore companies as well.  Neutral in my position on them at the moment, but waiting for an oppertune time to short them again.

The rise of US Debt levels

After some further reading and research I came across this article from the New York times via a Google Search and blog article from Steady Blogging.

It is a great visual interactive graphic of the rise and history of US consumer debt levels.  I suppose this is a reflection of what happened across the world as well, especially in countries with high debt levels.  From the NYT link, click on “series index”, then click on “The American Way of Debt” and then click “Launch Interactive”.

It is debt and credit growth that spurred the massive asset price inflation of the past 2 decades, and it is the restriction of credit growth or deleveraging of these debt levels that will limit asset growth or even deflate asset prices world wide.  Investors and traders need to have more than one tool in their tool box to be able to take advantage of this and protect their own capital.